Table Of Contents
Diagram
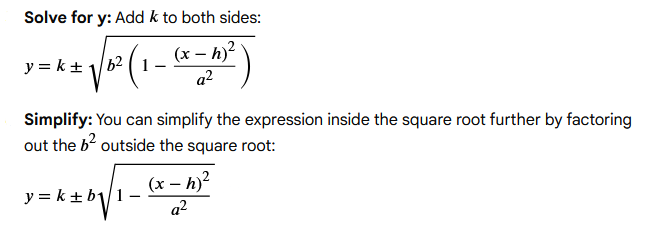
Using the Ellipse Standard Equation
Using the Ellipse Parametric Equations
Using the Ellipse Standard Equation
Using the Ellipse Parametric Equations
Diagram
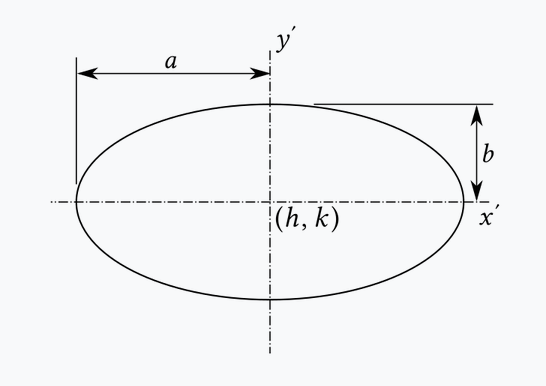
Image From: commons.wikimedia.org
Using the Ellipse Standard Equation
#!/usr/bin/python3
# ==============================================================
# X,Y points on an ellipse
# ==============================================================
#
# ellipse test case: h = 0, k = 0, a = 2, b = 3, x = 1
#
# two possible Y values, approximately 2.60 and -2.60
#
# =============================================================
#
# the standard equation for an ellipse:
#
# (x-h)**2 (y-k)**2
# -------- + -------- = 1
# a**2 b**2
#
# (h,k) coord (X,Y) of the center of the ellipse
# (normally 0,0 for simplicity)
#
# a semi-major axis (parallel to the plot X axis)
# b semi-minor axis (parallel to the plot Y axis)
#
# code version of the equation:
#
# y1 = k + math.sqrt(b**2 * (1 - ((x-h)**2)/a**2))
# y2 = k - math.sqrt(b**2 * (1 - ((x-h)**2)/a**2))
#
# ==============================================================
#
# Definition:
#
# The semi-major axis is the line segment from the center
# of the ellipse to one of its vertices along the longest
# axis. It is exactly half the length of the major axis,
# which is the ellipse's longest diameter.
#
# ==============================================================
import coordinate_conversion as cc
import graphics as gr
import math
# --------------------------------------------------------------
# ---- ellipse class
# --------------------------------------------------------------
class Ellipse():
# ---- initialize
def __init__(self, semi_axis_a, semi_axis_b, h=0.0, k=0.0):
self.a = semi_axis_a
self.b = semi_axis_b
self.h = h
self.k = k
# ---- calculate an ellipse's y values given a x value
def y(self,x):
y1 = k + math.sqrt(self.b**2 * \
(1 - ((x-self.h)**2)/self.a**2))
y2 = k - math.sqrt(self.b**2 * \
(1 - ((x-self.h)**2)/self.a**2))
return(y1,y2)
# ---- display the ellipse internals
def display(self,title='ellipse'):
print()
print(title)
print(f'a = {self.a}')
print(f'b = {self.b}')
print(f'h = {self.h}')
print(f'k = {self.k}')
print()
# --------------------------------------------------------------
# ---- draw a point (small circle)
# --------------------------------------------------------------
def draw_point(win, x, y):
# ---- convert Cartesian to window coordinates
wx,wy = cc.center_to_win_coords(x,y,win.width,win.height)
# ---- draw small circle
c = gr.Circle(gr.Point(wx,wy),4)
c.setOutline('black')
c.setWidth(1)
c.setFill('red')
c.draw(win)
# --------------------------------------------------------------
# ---- create graphics window/canvas
# --------------------------------------------------------------
def create_graphics_window(title, width=401, height=401):
# ---- graphics window/canvas
win = gr.GraphWin('Draw Ellipse', width, height)
win.setBackground('white')
wintop = gr.Line(gr.Point(0,0), gr.Point(width-1,0))
wintop.setWidth(1)
wintop.setFill('black')
wintop.draw(win)
# ---- X axis
xax = gr.Line(gr.Point(0,width/2),
gr.Point(width-1, height/2))
xax.setWidth(1)
xax.setFill('black')
xax.draw(win)
# ---- Y axis
yax = gr.Line(gr.Point(width/2, 0),
gr.Point(width/2, height-1))
yax.setWidth(1)
yax.setFill('black')
yax.draw(win)
return win
# --------------------------------------------------------------
# ---- draw an ellipse
# ---- a is assumed to be the plot X axis
# ---- b is assumed to be the plot Y axis
# --------------------------------------------------------------
def draw_ellipse(ellip:Ellipse):
a = ellip.a
b = ellip.b
h = ellip.h
k = ellip.k
win = create_graphics_window('Draw Ellipse')
# ---- draw ellipse X,Y coordinates
for x in range(0,round(a+1),10):
# ---- stay inside the X plot range
# ---- outside is an error (use try...catch?)
if x > ellip.a:
print(f'skipping x = {x}')
continue
# ---- draw ellipse (note: y=0 is drawn twice)
y1,y2 = ellip.y(x)
draw_point(win,x,y1)
draw_point(win,x,y2)
draw_point(win,-x,y1)
draw_point(win,-x,y2)
# ---- wait to stop the program
win.getMouse()
win.close()
# --------------------------------------------------------------
# ---- test ellipse X,Y coordinate equation
# --------------------------------------------------------------
def test_ellipse_equation(x,a,b,h=0.0,k=0.0):
# ---- use the equations
y1 = k + math.sqrt(b**2 * (1-((x-h)**2)/a**2))
y2 = k - math.sqrt(b**2 * (1-((x-h)**2)/a**2))
print(f'x = {x}, y1 = {y1}')
print(f'x = {x}, y2 = {y2}')
# ---- use my ellipse class/object
elip = Ellipse(a,b)
print(f'ellipse: y = {elip.y(x)}')
# --------------------------------------------------------------
# ---- main
# --------------------------------------------------------------
if __name__ == '__main__':
# ---- test
a = 2 # semi-axis (x axis)
b = 3 # semi-axis (y axis)
h = 0 # ellipse center X coord
k = 0 # ellipse center Y coord
print()
print('-'*50)
test_ellipse_equation(1,a,b)
print()
test_ellipse_equation(1,1.5,b)
print()
test_ellipse_equation(2,a,b)
##print()
##test_ellipse_equation(3,a,b)
print('-'*50)
# ---- using the ellipse class/object, draw an ellipse
a = 100 # semi-major axis (plot X axis)
b = 50 # semi-minor axis (plot Y axis)
h = 0 # ellipse center X coord
k = 0 # ellipse center Y coord
ellip = Ellipse(a,b)
ellip.display('testing the ellipse class')
draw_ellipse(ellip)
More Information on the ellipse equation.
Using the Ellipse Parametric Equations
The coordinates of any point on the ellipse can be generated using the parametric equations:
x = h + a * cos(t)
y = k + b * sin(t)
#!/usr/bin/python3
# ==============================================================
# ellipse X,Y values
# ==============================================================
#
# ellipse parametric equations
#
# x = h + a * cos(t)
#
# y = k + b * sin(t)
#
# (h,k) is the center of the ellipse
#
# a is the semi-axis length along the x-direction
# b is the semi-axis length along the y-direction
# t is a parameter that ranges from 0 to 2π radians
# (0° to 360°)
#
# ==============================================================
#
# Definition:
#
# The semi-major axis is the line segment from the center
# of the ellipse to one of its vertices along the longest
# axis. It is exactly half the length of the major axis,
# which is the ellipse's longest diameter.
#
# ==============================================================
import coordinate_conversion as cc
import graphics as gr
import math
# --------------------------------------------------------------
# ---- ellipse class
# --------------------------------------------------------------
class EllipseParametric():
# ---- initialize
def __init__(self, semi_axis_a, semi_axis_b, h=0, k=0):
self.a = semi_axis_a
self.b = semi_axis_b
self.h = h
self.k = k
# ---- calculate an ellipse's x,y coordinates
# ---- given an angle in degrees
def xy(self,deg):
rad = math.radians(deg)
x = self.h + self.a * math.cos(rad)
y = self.k + self.b * math.sin(rad)
return(x,y)
# ---- display the ellipse internals
def display(self,title='Ellipse (Parametric)'):
print()
print(title)
print(f'a = {self.a}')
print(f'b = {self.b}')
print(f'h = {self.h}')
print(f'k = {self.k}')
print()
# --------------------------------------------------------------
# ---- draw a point (small circle)
# --------------------------------------------------------------
def draw_point(win, x, y):
# ---- convert Cartesian to window coordinates
wx,wy = cc.center_to_win_coords(x,y,win.width,win.height)
# ---- draw small circle
c = gr.Circle(gr.Point(wx,wy),4)
c.setOutline('black')
c.setWidth(1)
c.setFill('red')
c.draw(win)
# --------------------------------------------------------------
# ---- create graphics window/canvas
# --------------------------------------------------------------
def create_graphics_window(title, width=401, height=401):
# ---- graphics window/canvas
win = gr.GraphWin('Draw Ellipse', width, height)
win.setBackground('white')
wintop = gr.Line(gr.Point(0,0), gr.Point(width-1,0))
wintop.setWidth(1)
wintop.setFill('black')
wintop.draw(win)
# ---- X axis
xax = gr.Line(gr.Point(0,width/2),
gr.Point(width-1, height/2))
xax.setWidth(1)
xax.setFill('black')
xax.draw(win)
# ---- Y axis
yax = gr.Line(gr.Point(width/2, 0),
gr.Point(width/2, height-1))
yax.setWidth(1)
yax.setFill('black')
yax.draw(win)
return win
# --------------------------------------------------------------
# ---- draw an ellipse
# ---- a is assumed to be the plot X axis
# ---- b is assumed to be the plot Y axis
# --------------------------------------------------------------
def draw_ellipse_parametric(ellip):
a = ellip.a
b = ellip.b
h = ellip.h
k = ellip.k
win = create_graphics_window('Parametric Equations Ellipse')
# ---- draw ellipse X,Y coordinates
for deg in range(0,360,10):
x,y = ellip.xy(deg)
draw_point(win,x,y)
# ---- wait to stop the program
win.getMouse()
win.close()
# --------------------------------------------------------------
# ---- main
# --------------------------------------------------------------
if __name__ == '__main__':
# ---- using the ellipse class/object, draw an ellipse
a = 150 # semi-major axis (plot X axis)
b = 100 # semi-minor axis (plot Y axis)
h = 0 # ellipse center X coord
k = 0 # ellipse center Y coord
ellip = EllipseParametric(a,b)
ellip.display('testing the (parametric) ellipse class')
draw_ellipse_parametric(ellip)
Add to the above code
function draw_point - optionally draw a point with a different color and width.
function draw_ellipse - optionally draw a point at the center of the ellipse (different color and width).